The United States imported 111,950 metric tons of tea worth $620.4 million in 2025, per UN Comtrade. Since 2015 the import bill rose 32.3% while volume fell 13.7%. Japan, almost all green tea, added $151.9 million over those ten years, more than the whole $151.5 million increase. The Tea Association of the USA counted almost 86 billion servings in 2023, about 86% of them black tea and roughly 75–80% served iced.
The 2025 numbers in one place
All figures below cover true tea (Camellia sinensis) in tariff heading 0902. Herbal blends, bottled tea and instant tea sit in other headings and are handled in the last section.
- Imports: 111,950 metric tons, $620.4 million customs value (UN Comtrade).
- Average import value: $5.54 per kg, up from $3.61 in 2015.
- Re-exports: 8.63 million kg worth $95.2 million left the country (Comtrade, US exports of 0902), leaving about 103.3 million kg at home.
- Per person: 103.3 million kg over 341,784,857 residents (Census Vintage 2025) is about 302 g of dry leaf per person per year.
- First half of 2026: imports ran 12.1% ahead of the first half of 2025 by value and 6.8% behind by volume, as covered in our tea tariffs and prices report.
Get the tea newsletter
New tea rooms, brewing notes, and tea worth trying. Free, no spam.
No fixed schedule. Unsubscribe anytime.
US tea imports by year, 2015 to 2025
Volume peaked in 2016 at 131,066 tons and has drifted down since. Value did the opposite: between $469 million and $488 million every year from 2015 through 2020, then up to $620.4 million in 2025.
| Year | Volume (metric tons) | Value ($ million) | Value per kg |
|---|---|---|---|
| 2015 | 129,708 | 468.8 | $3.61 |
| 2016 | 131,066 | 483.1 | $3.69 |
| 2017 | 126,301 | 486.6 | $3.85 |
| 2018 | 119,357 | 487.3 | $4.08 |
| 2019 | 117,997 | 488.4 | $4.14 |
| 2020 | 106,377 | 473.8 | $4.45 |
| 2021 | 115,165 | 531.8 | $4.62 |
| 2022 | 119,643 | 559.7 | $4.68 |
| 2023 | 104,225 | 519.8 | $4.99 |
| 2024 | 123,362 | 578.6 | $4.69 |
| 2025 | 111,950 | 620.4 | $5.54 |
Source: UN Comtrade, US imports of HS 0902 from all countries, annual data reported by the United States, retrieved October 1, 2026. Value is customs value in US dollars, not adjusted for inflation.
Two dips stand out. 2020 volume fell to 106,377 tons and 2023 to 104,225 tons. The Tea Association's 2024 fact sheet attributes the 2023 drop to inventory built up during the 2021–2022 supply-chain problems, not to people drinking less.
The value-per-kg column is the clearest trend: $3.61 in 2015, $5.54 in 2025. Inflation and the 2025 tariffs push it up, and so does the mix: the expensive category grew while the cheap one shrank.
Green vs black: where the money moved
Black tea still dominates by weight. Green tea now takes almost half the money.
| Category (HS code) | 2015 value ($M) | 2025 value ($M) | 2015 volume (M kg) | 2025 volume (M kg) |
|---|---|---|---|---|
| Green, retail packs up to 3 kg (0902.10) | 64.8 | 161.9 | 4.82 | 7.55 |
| Green, bulk (0902.20) | 67.7 | 135.0 | 13.92 | 11.21 |
| Black and oolong, retail packs up to 3 kg (0902.30) | 130.0 | 163.1 | 14.47 | 20.11 |
| Black and oolong, bulk (0902.40) | 206.3 | 160.5 | 96.49 | 73.08 |
Source: UN Comtrade, subheadings 090210, 090220, 090230 and 090240; code definitions from the USITC tariff schedule.
- Green tea was 14.5% of import volume in 2015 and 16.8% in 2025. Its share of value went from 28.3% to 47.8%.
- Green imports were worth $296.8 million in 2025 at $15.83 per kg. Black and oolong were worth $323.5 million at $3.47 per kg.
- Black-tea volume fell from 111.0 million kg in 2015 to 93.2 million kg in 2025. Green volume was flat at about 18.8 million kg.
The green-tea value jump sits almost entirely in one country. Japan supplied $189.6 million of green tea in 2025, 63.9% of all US green-tea import value, and green tea was 99.6% of everything Japan shipped under 0902. Our guides to Japanese green tea types and matcha grades cover what those categories hold.
Who supplies America's tea
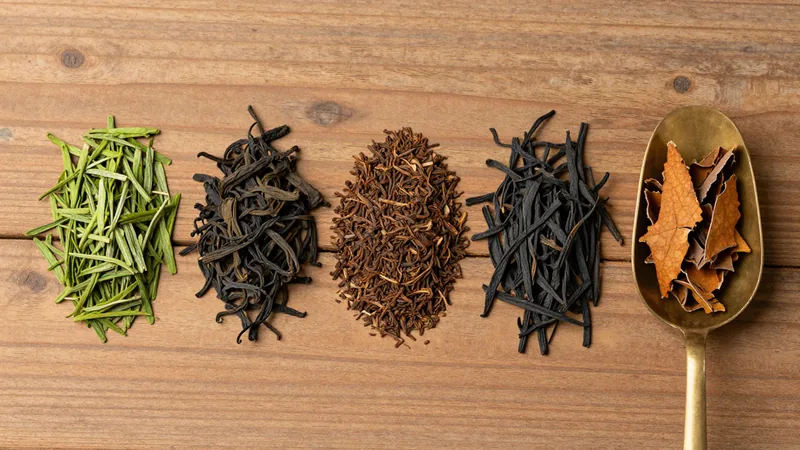
Five growing countries supply most of the value: Japan, India, China, Argentina and Sri Lanka.
| Origin | 2025 value ($M) | 2025 volume (M kg) | Value per kg | 2015 value ($M) |
|---|---|---|---|---|
| Japan | 190.3 | 4.70 | $40.47 | 38.3 |
| India | 63.0 | 12.11 | $5.20 | 59.0 |
| China | 55.9 | 11.43 | $4.89 | 102.4 |
| Argentina | 54.5 | 40.83 | $1.34 | 86.1 |
| Sri Lanka | 48.5 | 5.92 | $8.19 | 34.9 |
| Canada | 29.6 | 2.05 | $14.44 | 24.2 |
| United Kingdom | 23.6 | 1.86 | $12.67 | 13.8 |
| United Arab Emirates | 19.0 | 2.90 | $6.55 | 2.1 |
| Taiwan (reported as Other Asia, nes) | 18.9 | 2.25 | $8.41 | 8.9 |
| Germany | 18.5 | 2.40 | $7.70 | 22.9 |
Source: UN Comtrade, US imports of HS 0902 by partner, 2015 and 2025 annual, retrieved October 1, 2026. Ranked by 2025 value.
What the table shows:
- Japan and Argentina sit at opposite ends. Japanese tea averaged $40.47 per kg; Argentine tea $1.34 per kg. That is about $4.05 versus $0.13 of customs value per 100 g.
- Argentina is the bulk supplier. It shipped 40.6 million kg of black tea in 2025, 43.6% of all US black-tea import weight.
- China fell. Chinese tea imports dropped 45.5% in value between 2015 and 2025, to 9.0% of the total. The slide started long before the 2025 tariff fights; Chinese tea has also paid a 7.5% Section 301 duty since 2020. See the tariff timeline.
- Four of the top ten are not tea-growing origins. Canada, the United Kingdom, the United Arab Emirates and Germany are absent from the Tea Association's list of leading producing countries. Their shipments are tea grown elsewhere and blended or packed there.
The specialty market looks nothing like the customs data. Of the 5,903 teas with a stated origin in the Tea Explorer catalog (7,306 teas from 40 vendors, fetched 2026-10-01; samplers and teaware excluded), 76.4% are Chinese and 8.4% Japanese, and 1 is Argentine. China supplies 9.0% of import value but most of the loose-leaf variety sold online. Browse it on the tea price index.
What Americans drink: servings, iced tea, black vs green

The only national consumption estimate comes from the trade group. The Tea Association of the USA's 2024 fact sheet (covering 2023; no later edition was online when we checked on October 1, 2026) says:
- Americans consumed almost 86 billion servings of tea in 2023, close to 4 billion gallons.
- About 86% was black tea, 13.6% green, and the rest oolong, white and dark tea.
- Approximately 75–80% of tea consumed in America is iced.
- On any given day more than half of the population drinks tea, and tea is found in more than 80% of households.
Those numbers line up with customs data. The association reports 230 million pounds of black and green imports in 2023, down 12.9%. Comtrade shows 104,224,876 kg for 2023, which is 229.8 million pounds, down 12.9% from 2022. Green tea was 13.6% of 2023 import weight, matching the association's 13.6%.
Worked through per person, using the Census estimate of 336,755,052 residents in 2023:
- 86 billion servings is about 255 servings per person per year, or 0.7 a day.
- 4 billion gallons is about 11.9 gallons per person.
- 4 billion gallons over 86 billion servings is 6.0 fl oz per serving.
- 2023 imports minus re-exports (14.1 million kg) over 86 billion servings is about 1.05 g of dry leaf per serving. Instant tea and extracts, counted outside 0902, also feed those servings, so 1.05 g is a lower bound on tea input per serving. Compare the doses in how many grams of tea per cup.
The long view: tea per person since 1909
The USDA Economic Research Service tracked tea availability per person from 1909 to 2015 and stopped updating the series in February 2017 (ERS Food Availability Data System; spreadsheet). Figures are dry-leaf equivalent and include instant tea converted back to leaf.
| Year | Pounds per person | Gallons per person |
|---|---|---|
| 1909 | 1.14 | 10.67 |
| 1960 | 0.59 | 5.55 |
| 1990 | 0.73 | 6.88 |
| 2011 | 0.99 | 9.30 |
| 2015 | 0.88 | 8.26 |
Source: USDA ERS, coffee, tea and cocoa availability, Tea sheet, data last updated February 1, 2017.
Per-person availability fell by almost half between 1909 and 1960, recovered to a 2011 peak of 0.99 lb, then dropped 11.1% by 2015. Our 2025 figure of about 302 g (0.67 lb) is not directly comparable: it counts only leaf in heading 0902 and leaves out instant tea, which ERS converts into leaf.
What the numbers leave out
- Instant tea and extracts. Heading 2101.20 covers extracts, essences and concentrates of tea or maté. US imports were $231.3 million and 62.7 million kg in 2025, against $168.4 million and 70.9 million kg in 2015 (Comtrade 2101.20). The code mixes tea and maté, so it cannot be added to 0902 as tea.
- Herbal tea. Chamomile, rooibos and peppermint are not Camellia sinensis and are classified elsewhere.
- Domestic production. ERS left the production column blank for every year in its tea table. We found no federal series that measures US-grown tea, so none is shown here.
- Ready-to-drink tea. Bottled tea is made in the US from imported leaf and extract. We found no free, primary source for RTD volume or sales, so this report does not quote one.
Frequently Asked Questions
How much tea does the US import each year?
In 2025 the US imported 111,950 metric tons of tea under heading 0902, worth $620.4 million in customs value. That was 13.7% less tea by weight than in 2015 but 32.3% more money.
Where does most US tea come from?
By value, Japan led in 2025 with $190.3 million, followed by India, China, Argentina and Sri Lanka. By weight, Argentina leads by far with 40.8 million kg, almost all of it black tea, at about $1.34 per kg.
How much tea does the average American drink?
The Tea Association's estimate of almost 86 billion servings in 2023 works out to about 255 servings per person per year, or 11.9 gallons. Customs data for 2025 leave about 302 g of dry leaf per resident after re-exports.
Is most tea in the US iced?
Yes. The Tea Association puts the iced share at approximately 75–80% of tea consumed in America. About 86% of all tea consumed is black tea and 13.6% green.
Is green tea growing in the US?
By value, yes: green tea went from 28.3% of import value in 2015 to 47.8% in 2025, almost all of the gain from Japan. By weight it barely moved, at about 18.8 million kg a year.